Take a Tour
Scale System OverviewDevicesMetricsHierarchical Maps
Visibility Device catalogSearchGraphsHistorical MapsCustom dashboard
Data Accessibility
Programmability Use Case – QoS dropsCreate custom variableView new variableCreate % of new variable for alertView new custom alertUse Case – Site downCreate new tagCreate new variableCreate new custom alertView new alert
Architecture
Scale System OverviewDevicesMetricsHierarchical Maps

Our cloud-based architecture delivers unmatched scale, customizable views and complete programmability to deliver the metrics that matter to your business.
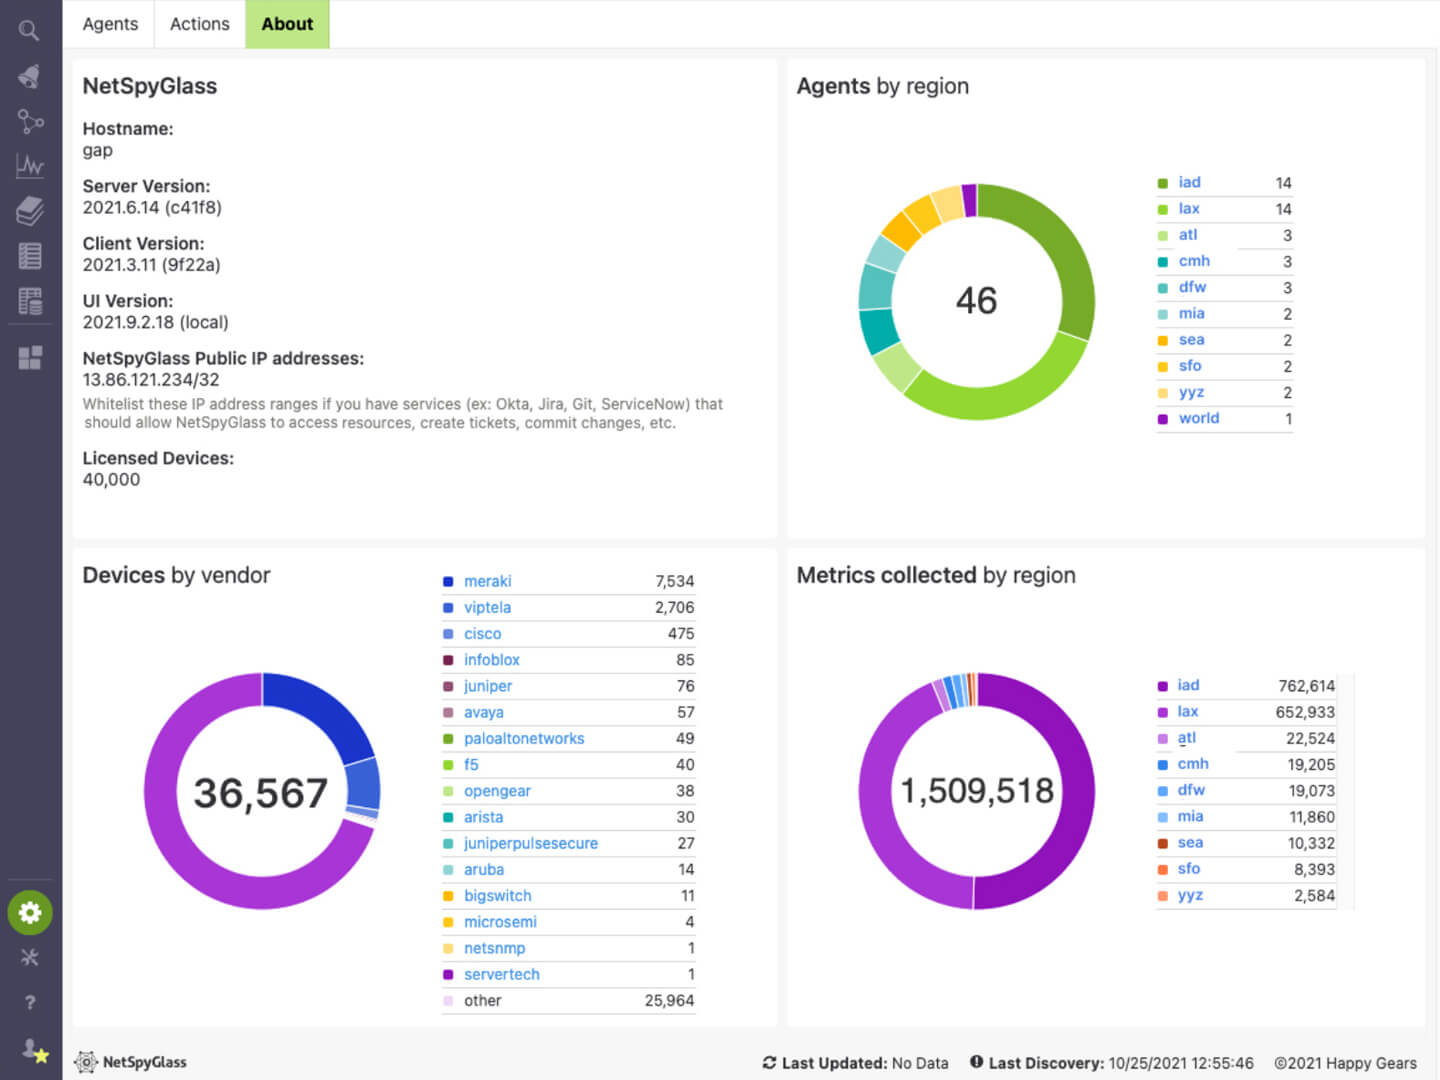
Our vendor-agnostic platform supports tens of thousands of devices
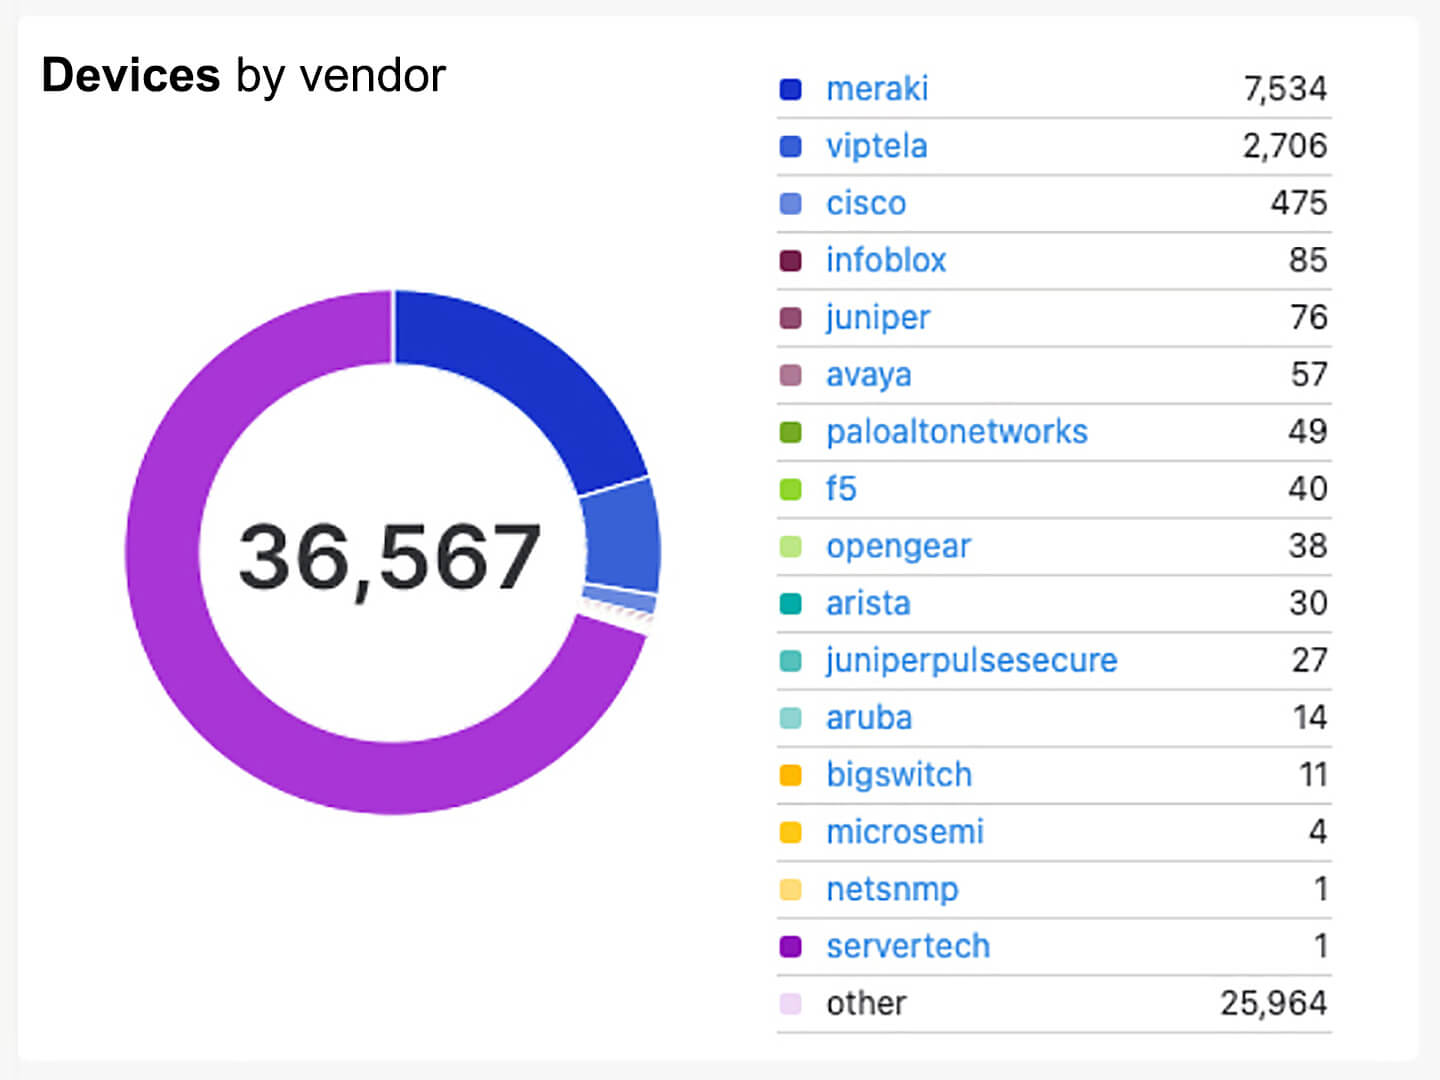
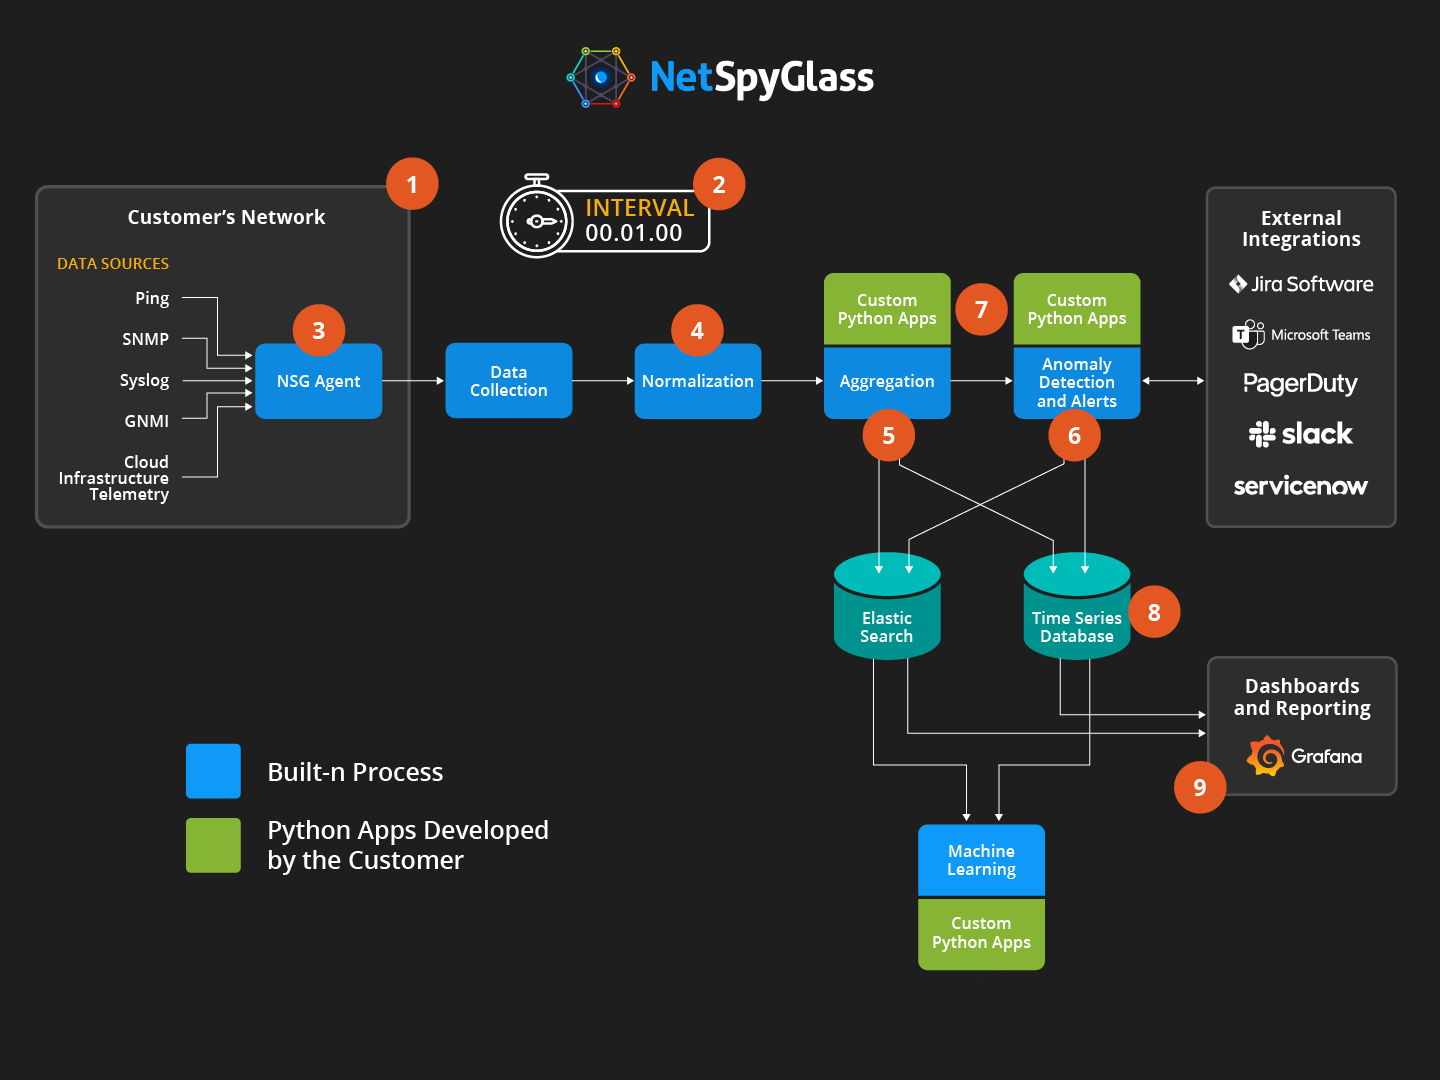
NSG shows millions of telemetry metrics, updated every minute. Data sources include syslog, API, SNMP, ICMP, streaming telemetry and cloud infrastructure.
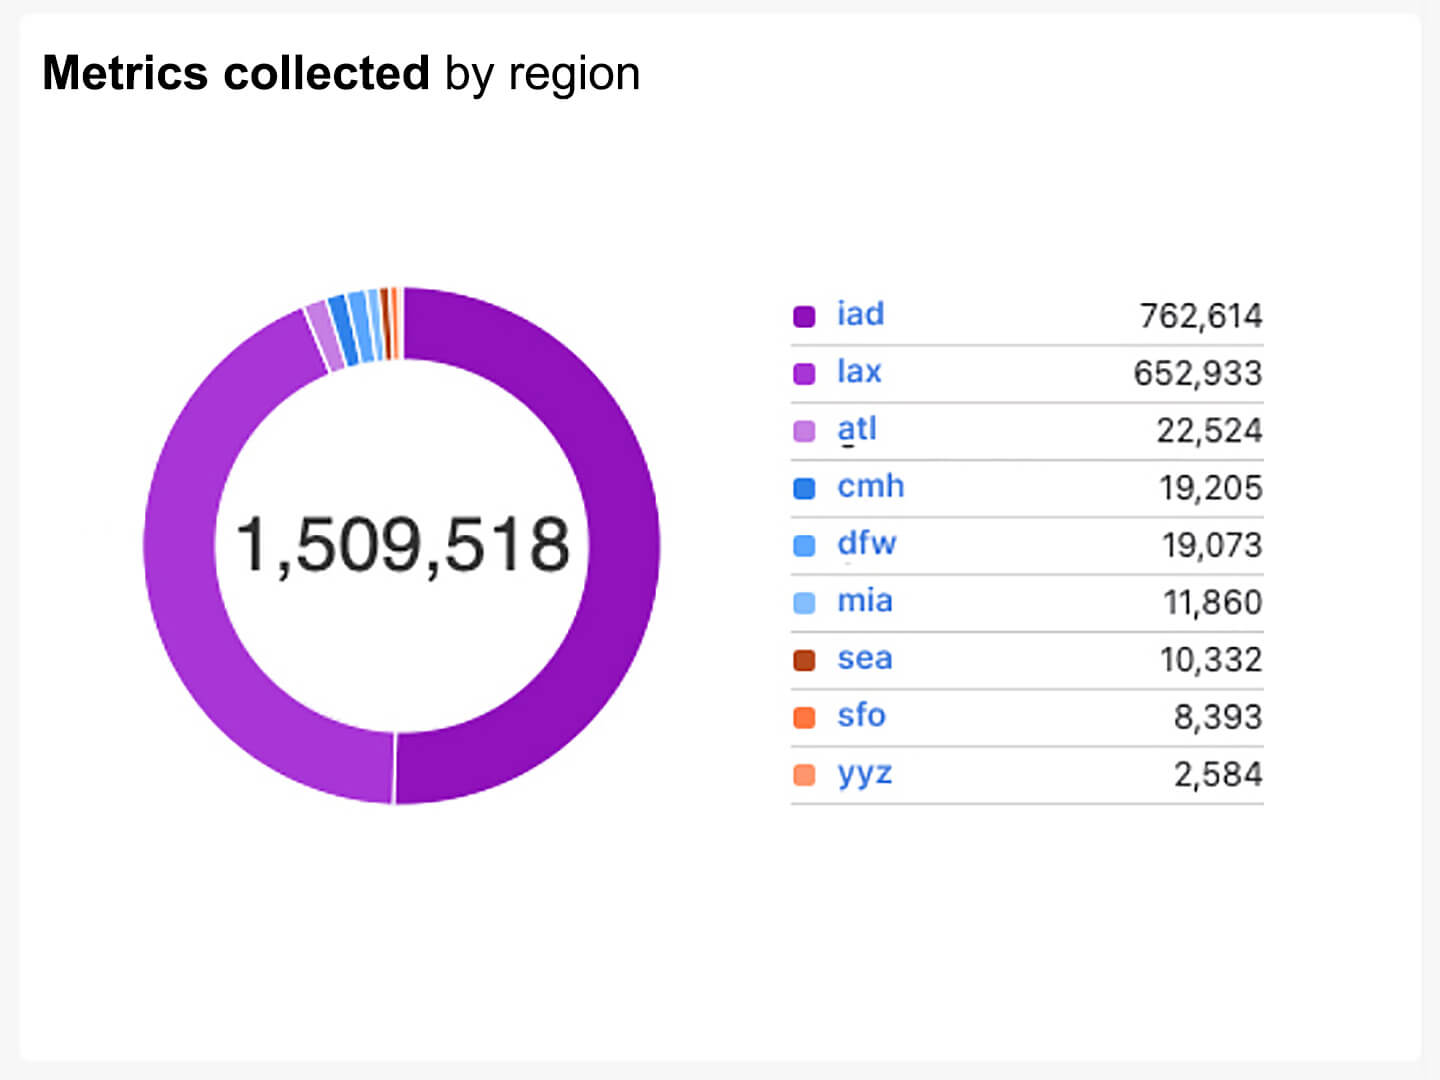
Go from an overview of your network to minute detail in just a few clicks.
Visibility Device catalogSearchGraphsHistorical MapsCustom dashboard

Catalog of devices, components, contracts & warranties.
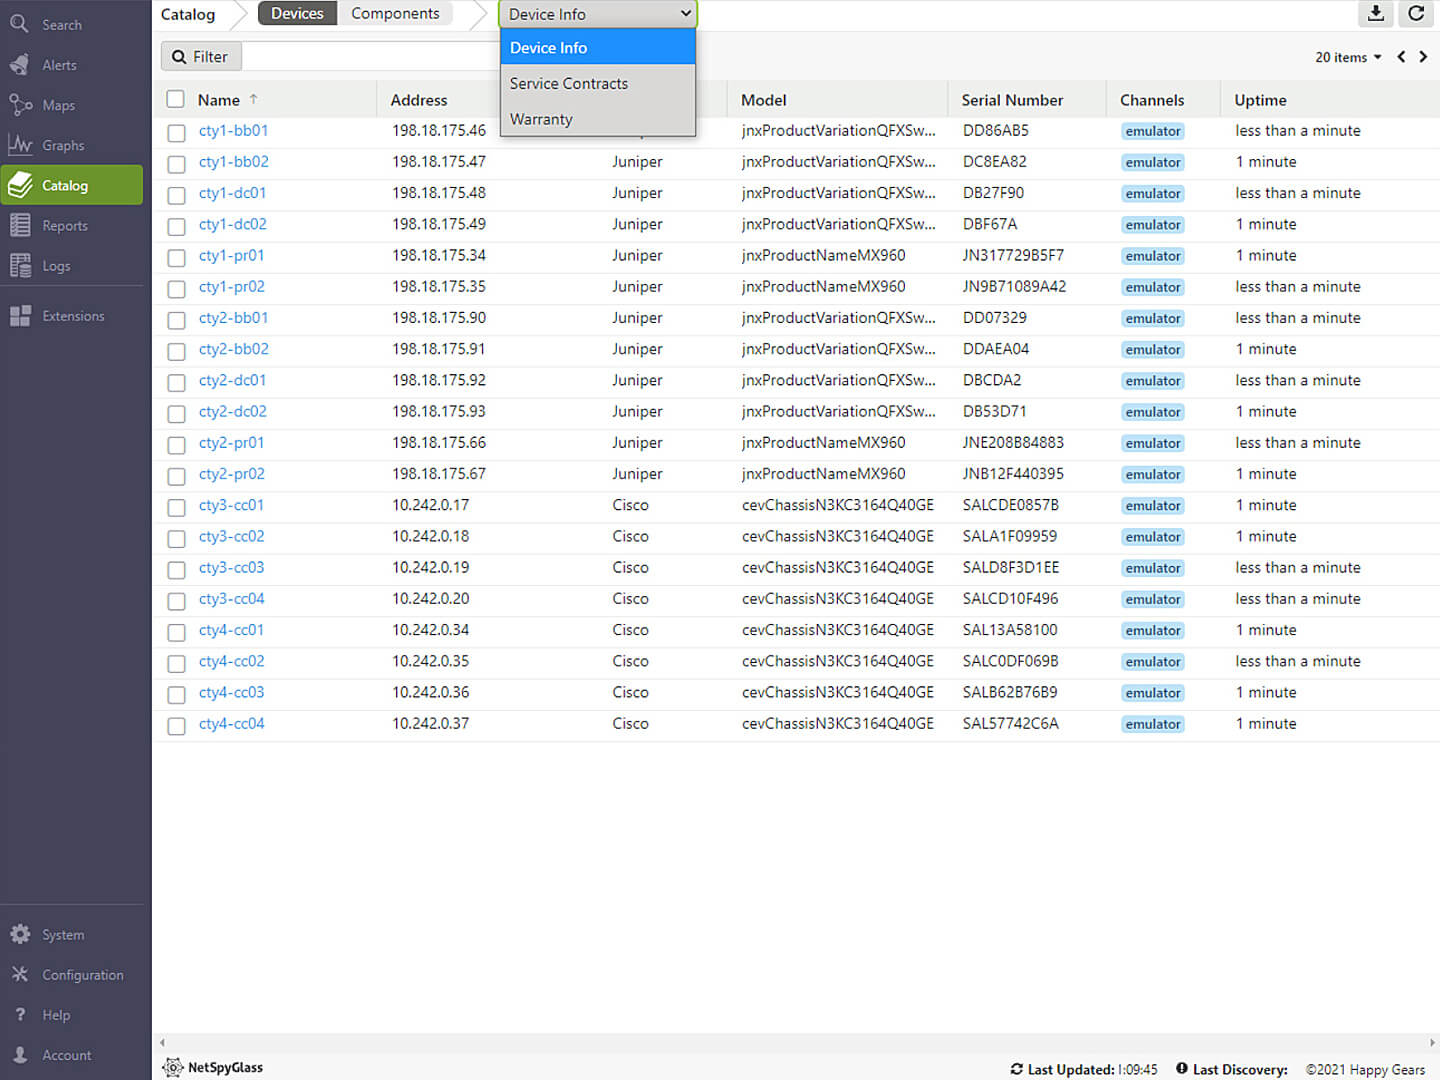
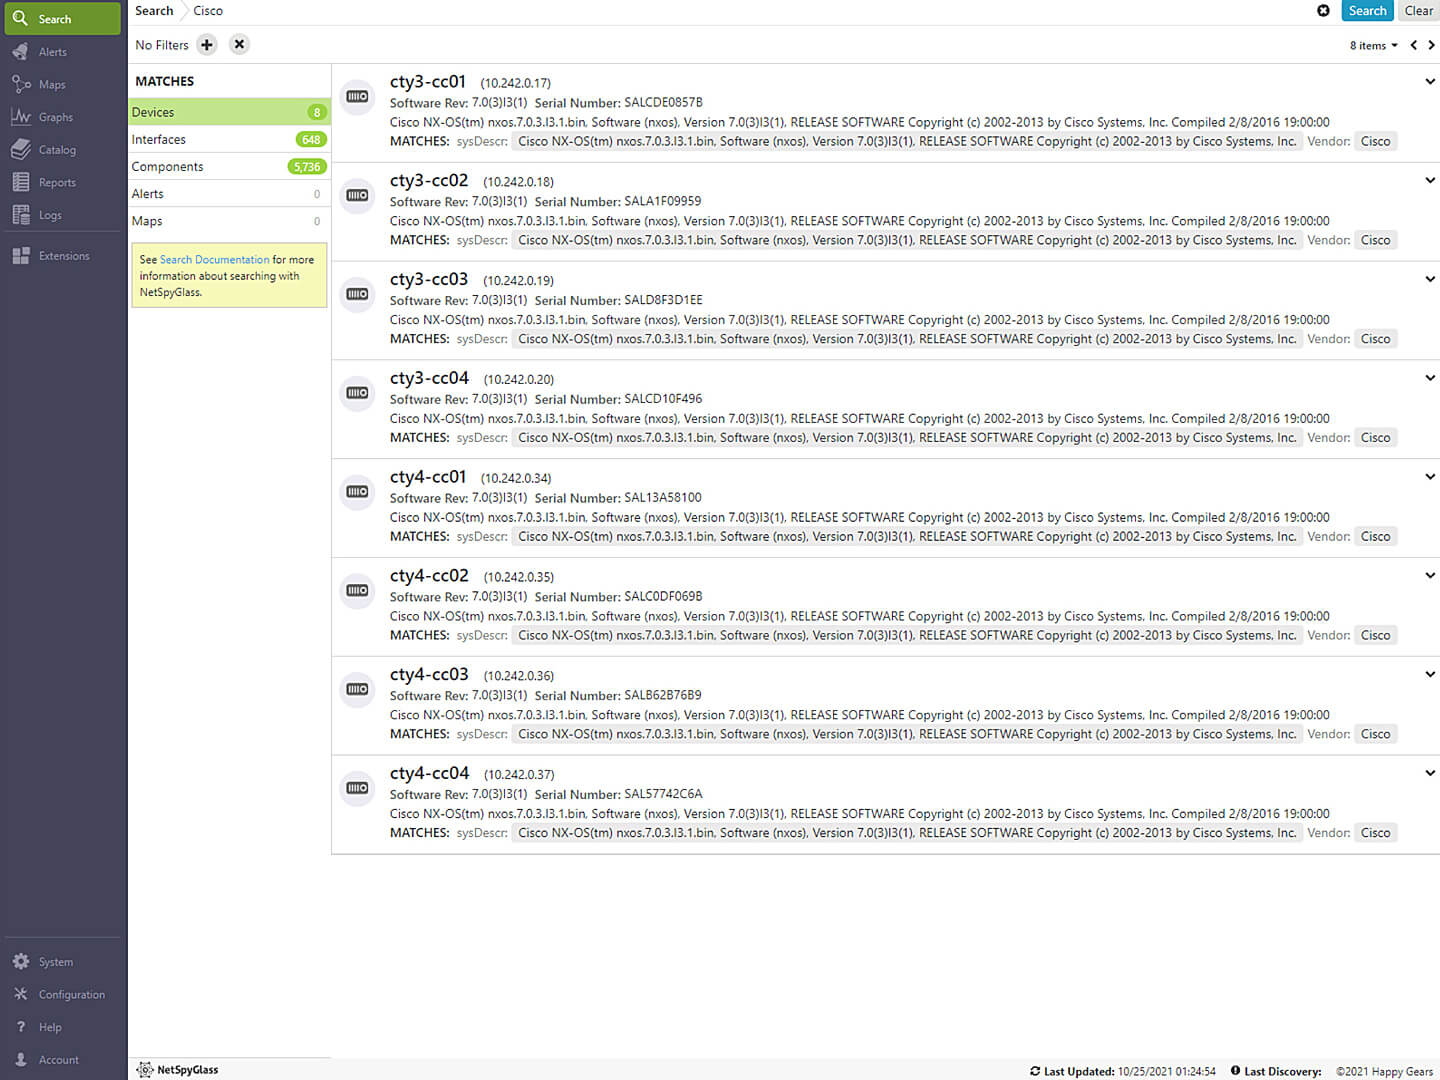
Search for devices, firmware, interfaces or components from one screen
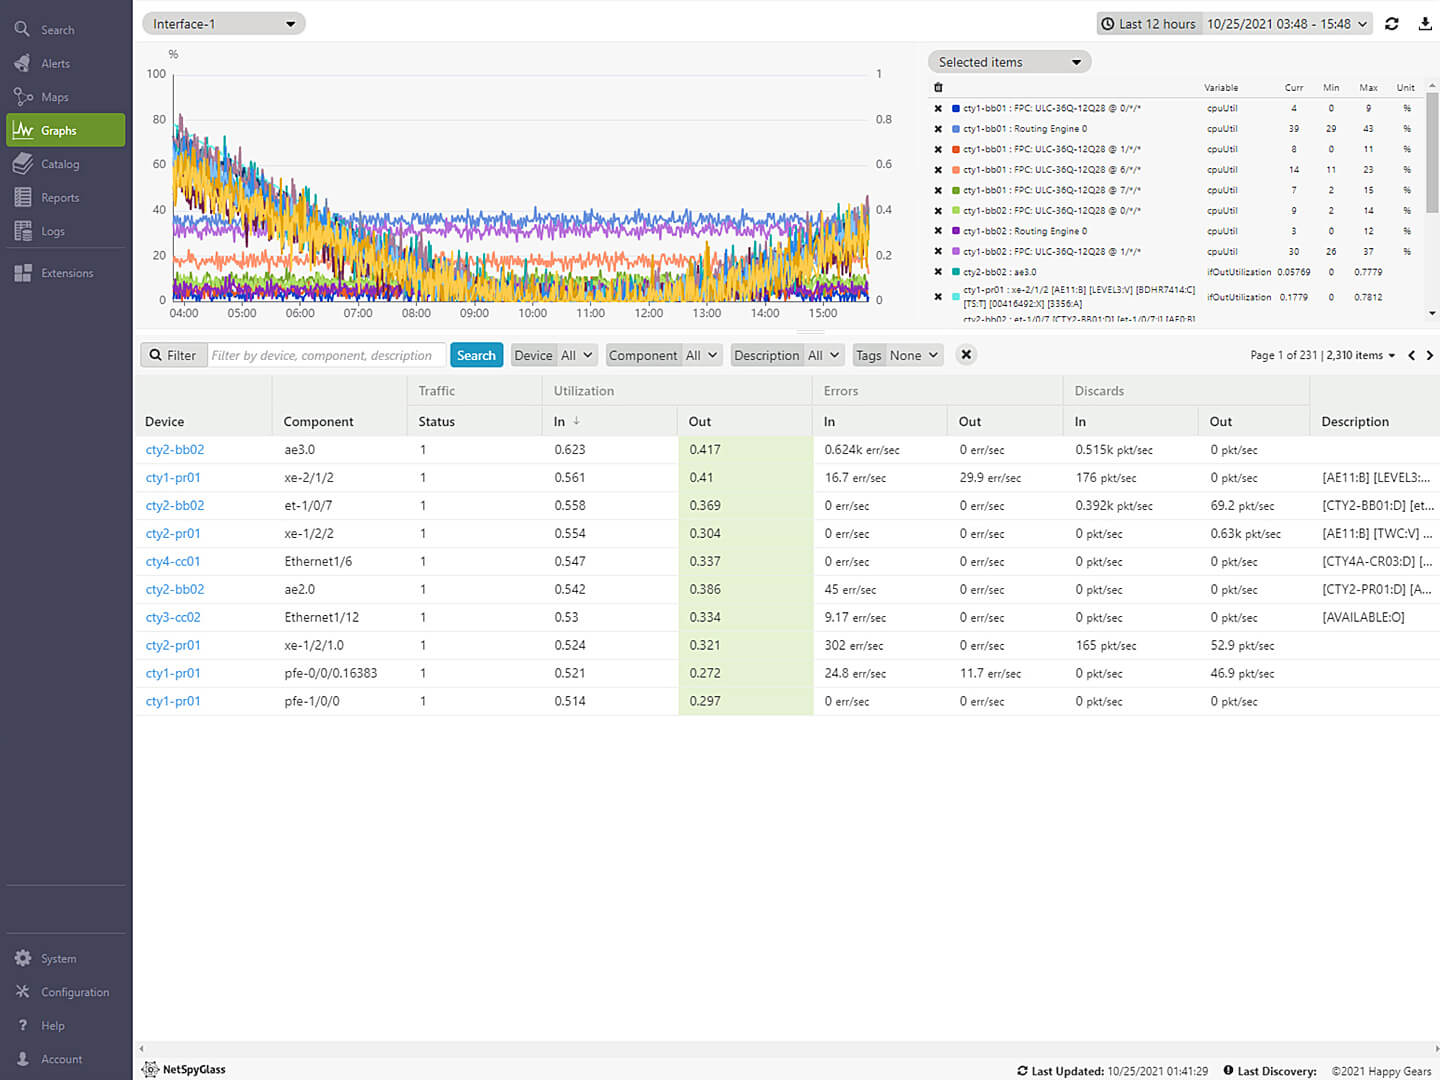
Select metrics and time period to quickly display status graphically.
See how devices and traffic paths change over time.
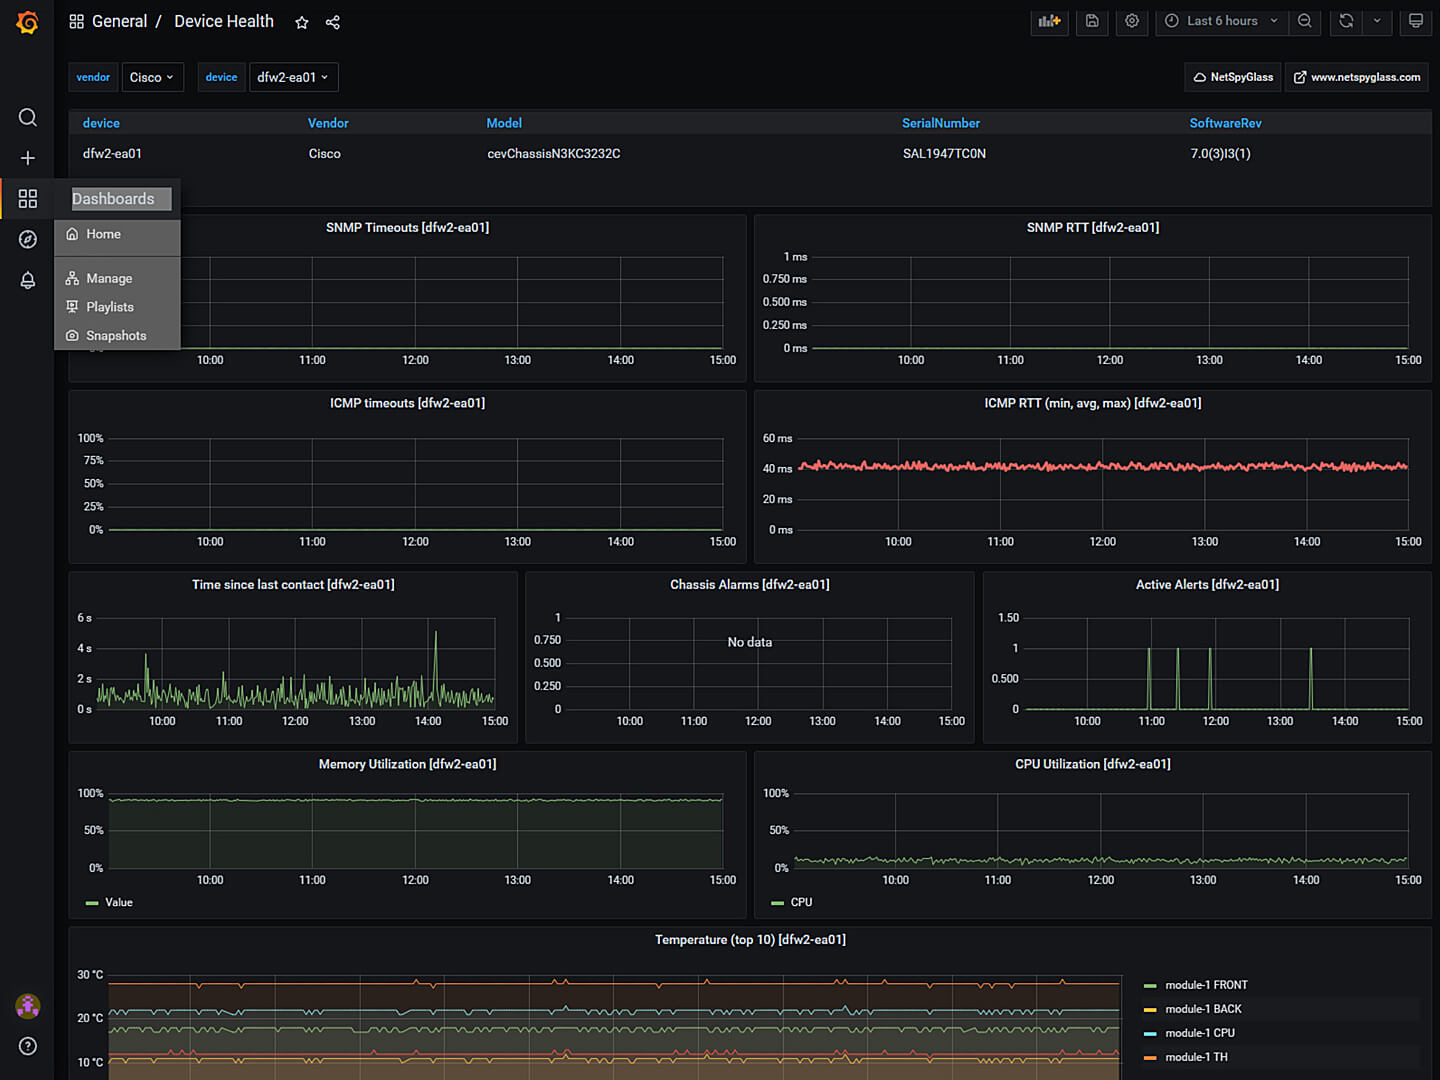
Create your own custom views, using the included Grafana instance or your own.
Data Accessibility
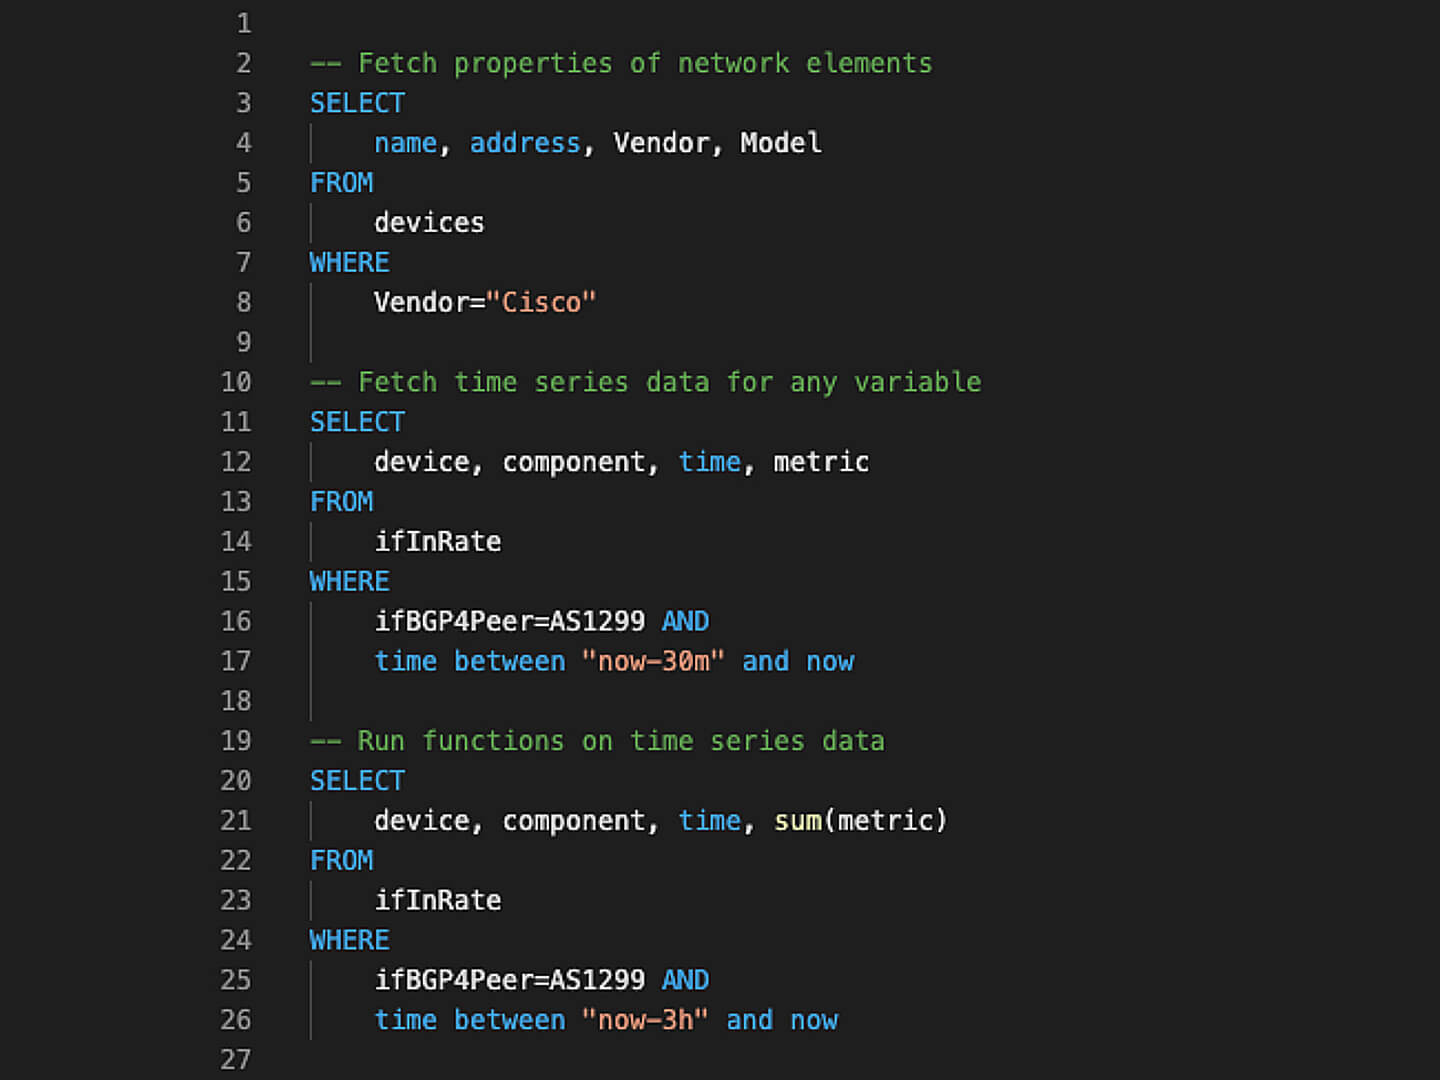
NSG uses a specialized version of SQL to visualize data and metrics through the portal. You can use NsgQL to import data into your own dashboards, program unique metrics with Python, or export data into other tools, with our JSON API.
Programmability Use Case – QoS dropsCreate custom variableView new variableCreate % of new variable for alertView new custom alertUse Case – Site downCreate new tagCreate new variableCreate new custom alertView new alert

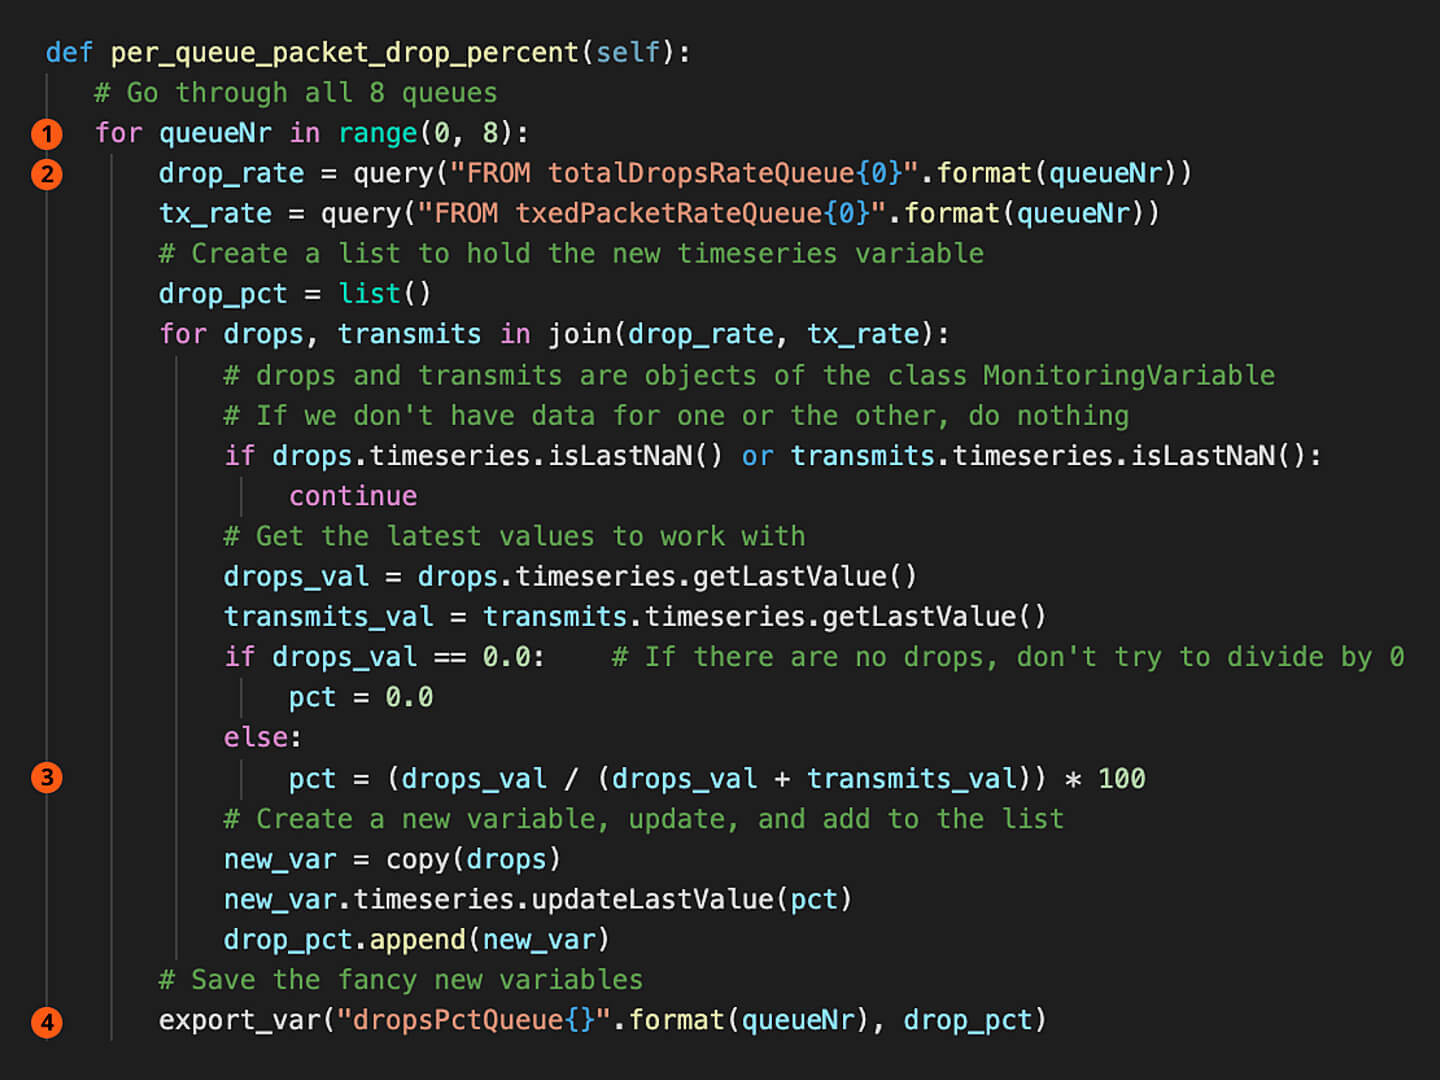
Use Case – QoS DropsNSG starts discovering information when you add devices, including QoS queues and variables like traffic and drop rates per queue. To track drops as a percentage of traffic, you simply create a custom variable we’ve called “dropPctQueue.” Click the arrow to see how to do it.

To create “dropPctQueue”For each queue
Import variables using NsgQL
Compute new value
Export value as new variable
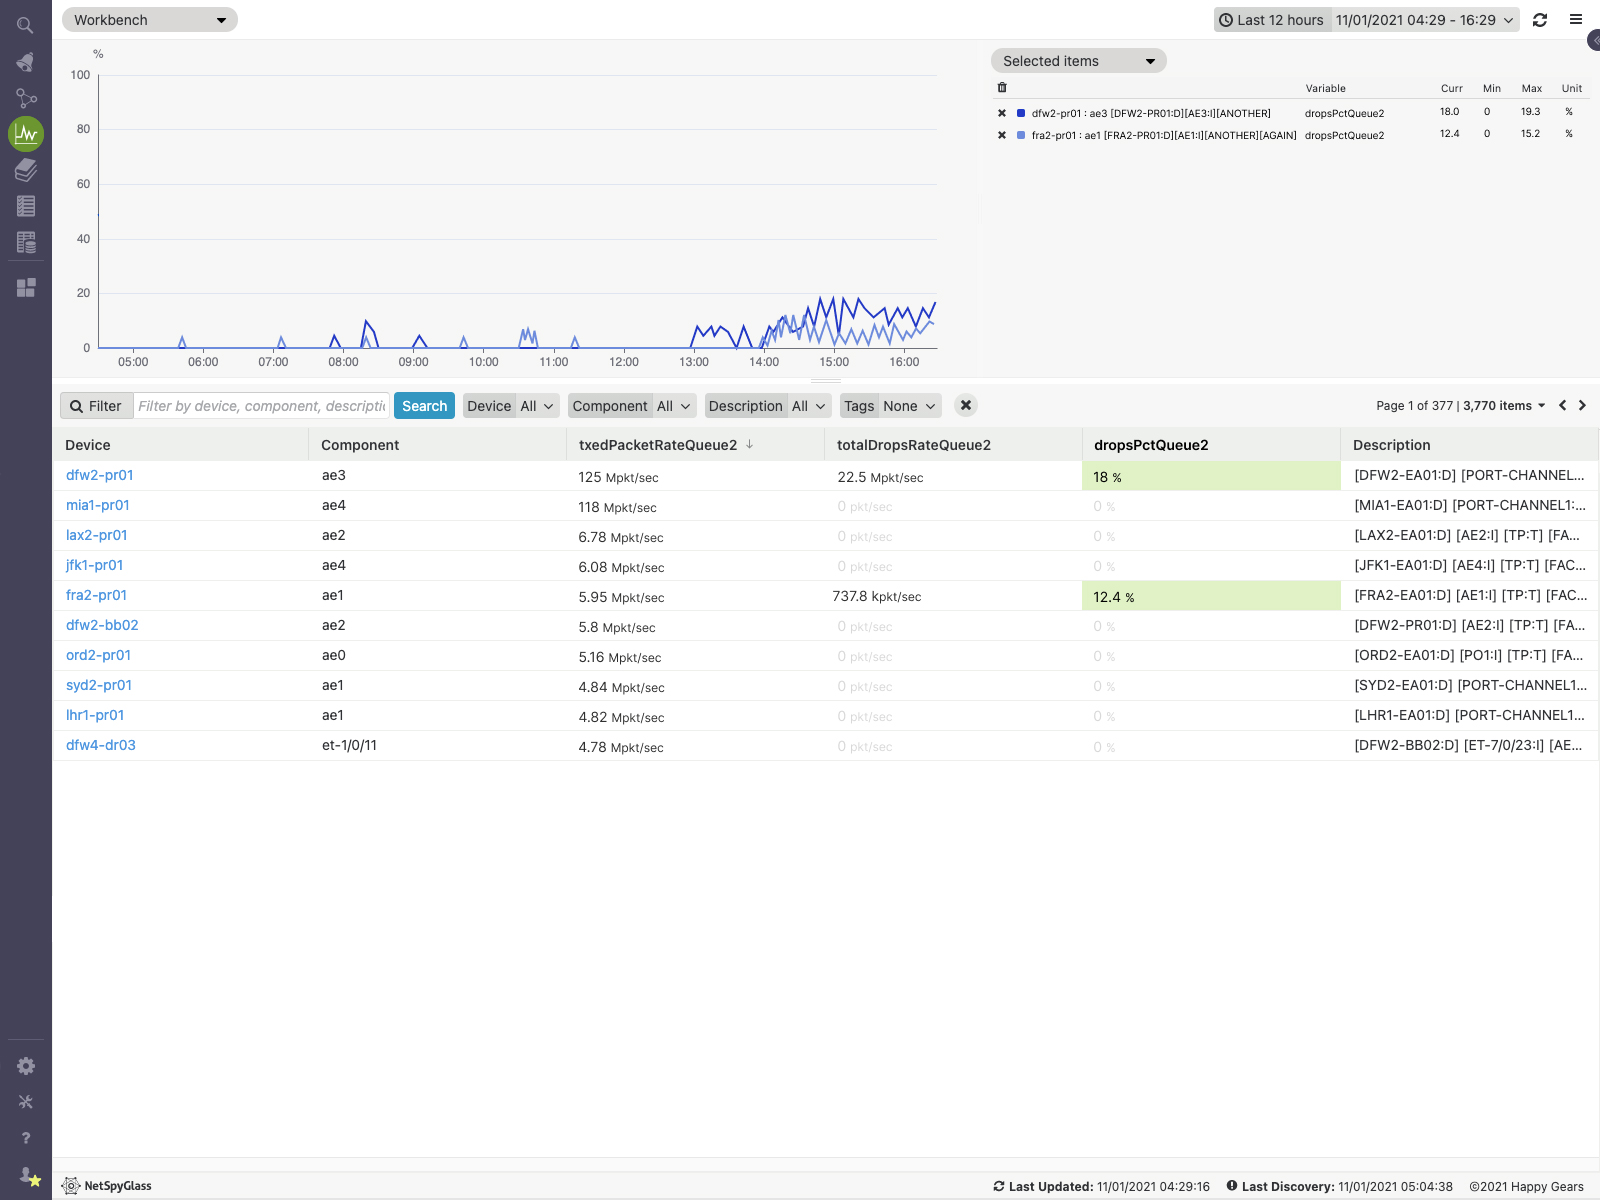
Your new custom variable is now available for use just like any of the out-of-the box variables. The next step is to create an alert that we’ve called “DropsPctQueueHigh” using this new variable.
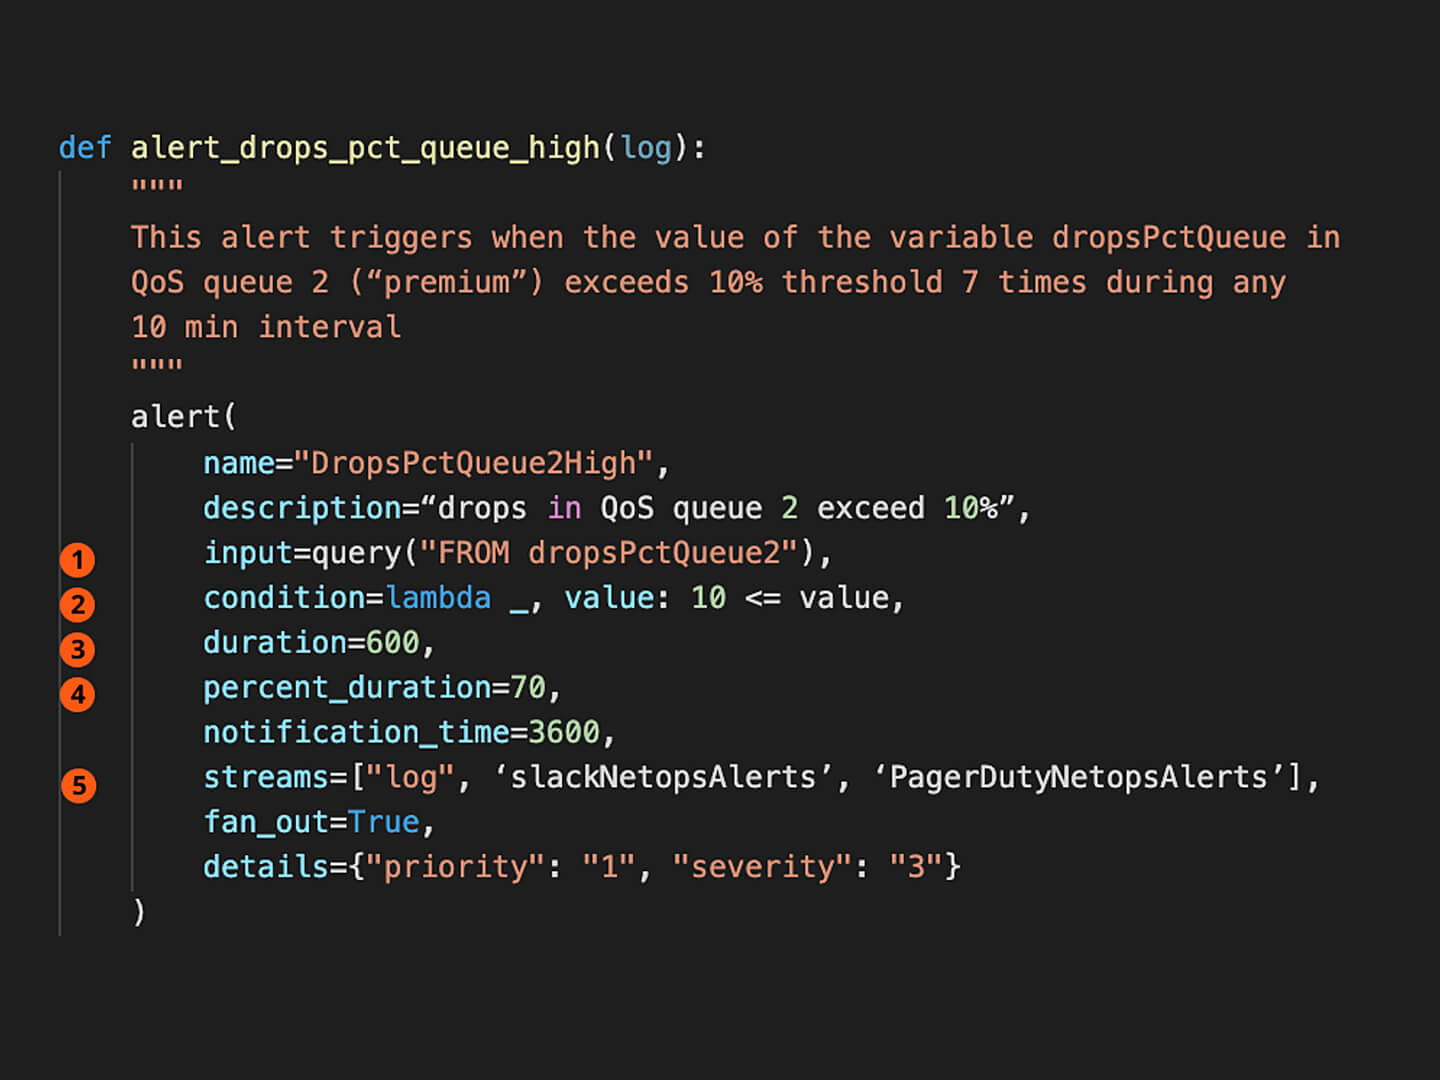
To create “DropsPctQueueHigh”Import dropsPctQueue variable using NsgQL
When value exceeds 10%…
…within a 10 minute window…
…at least 70% of that time
Alert becomes active and notifies selected streams.
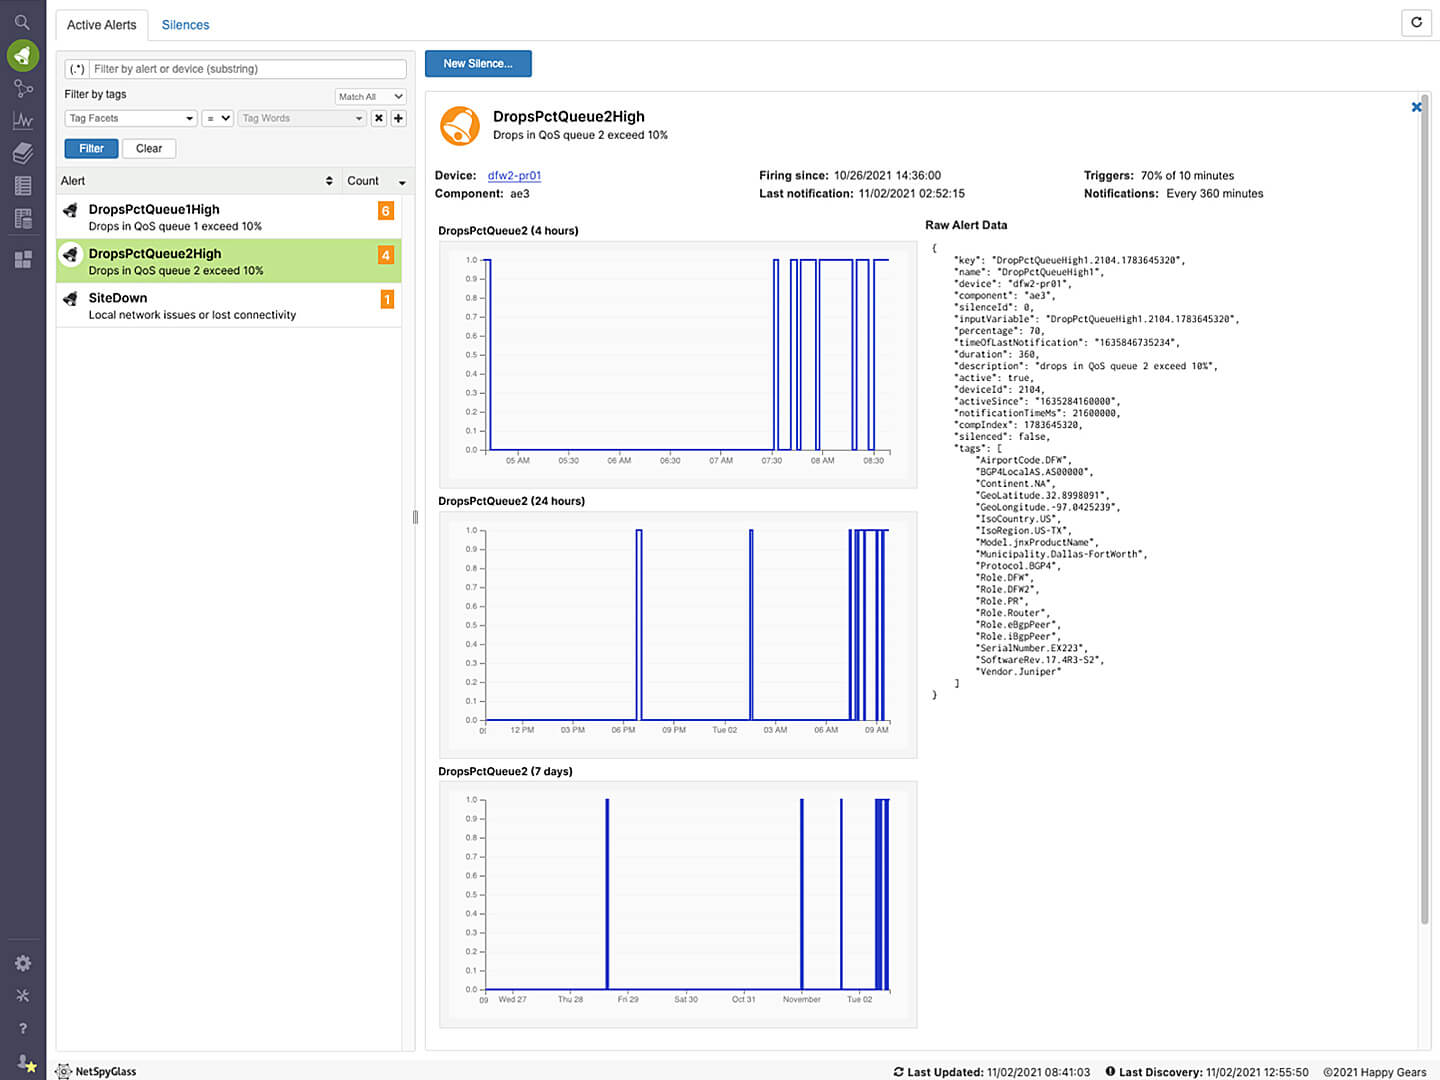
You can inspect active alerts in the UI where you see alert name, count of alerts of that type that are active at the moment, alert details and graphs showing the history of its state
Use Case – Site DownFor this example, we’ll assume that the site has switches behind one or more of the routers. In this example, we will define “Site down” if all switches and/or all routers are down First, we need to create a custom tag to identify devices by “Site,” a custom variable “siteStatus” to assign values to site performance, then create a custom alert, “siteDown” when the selected devices are down more than 10 minutes. Click the arrow to see how to do it.

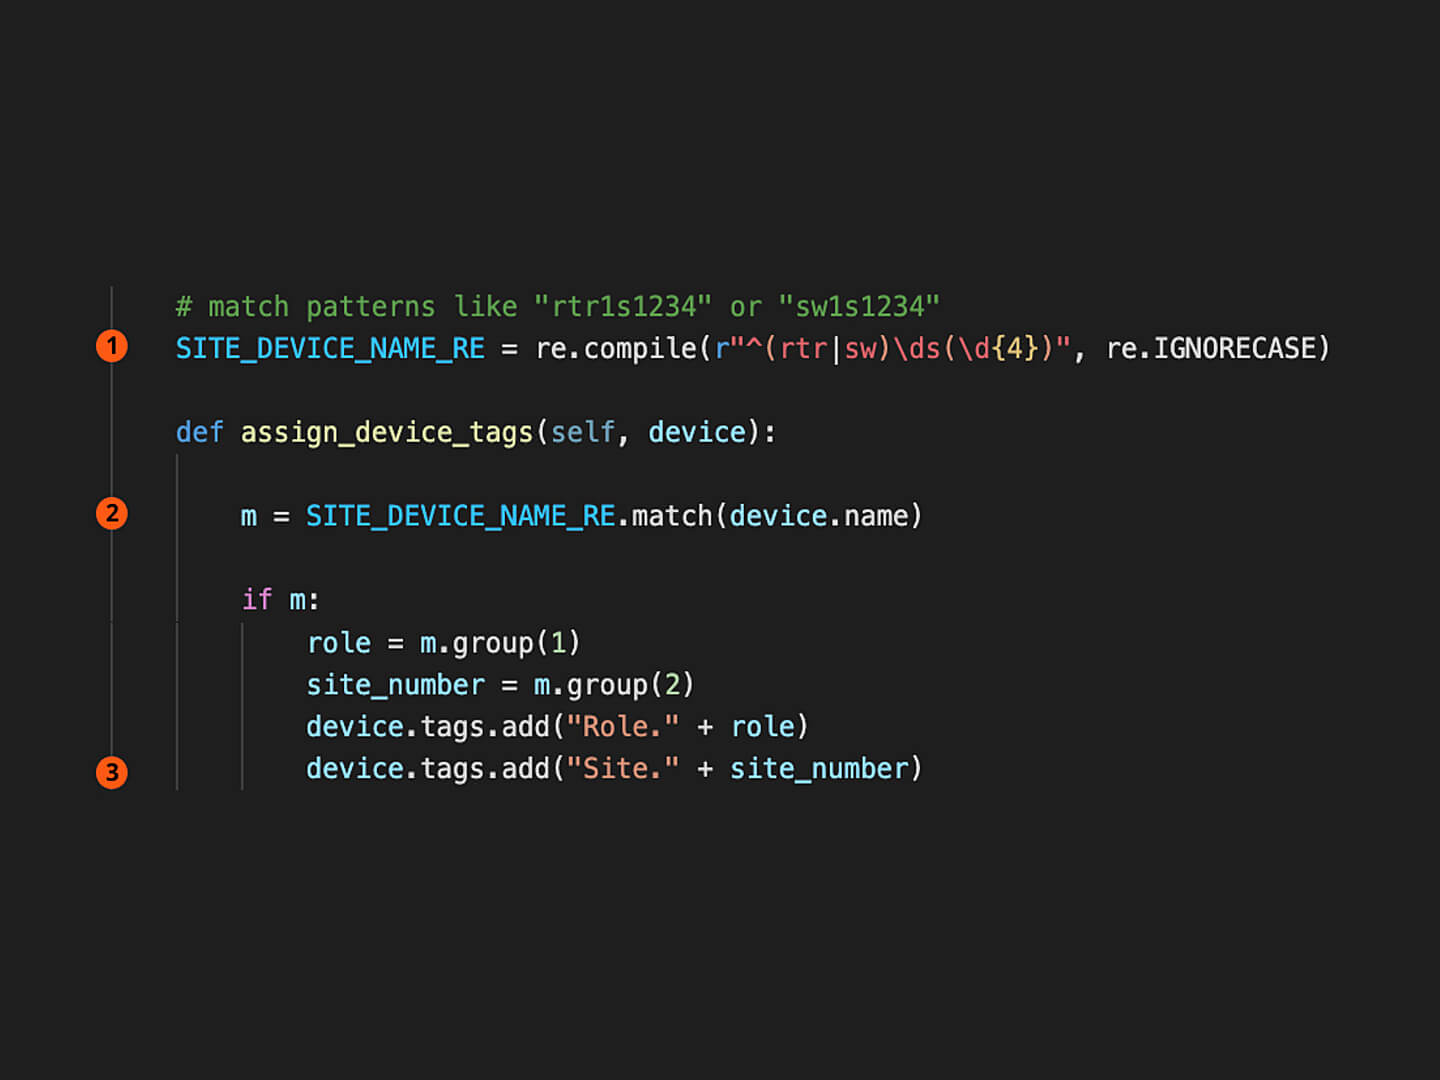
To create “Site” tagDevice naming convention described as regular expression
For each device, parse the name for Role and Site
Add Role and Site tags
You can use this tag to search, filter and work with devices per site
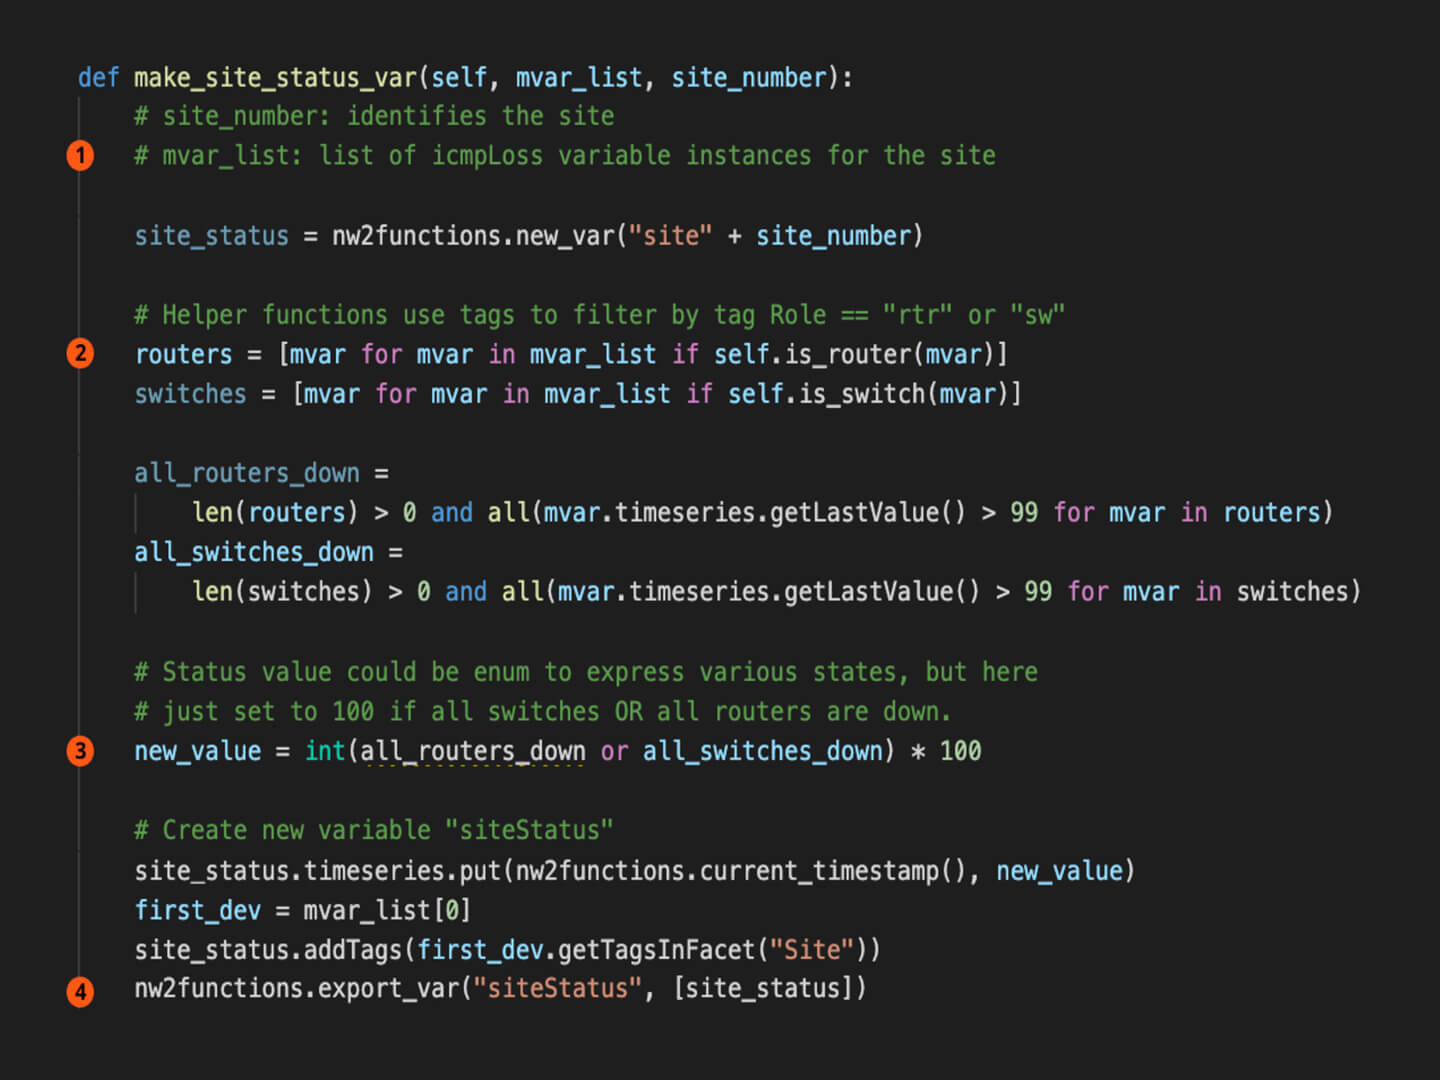
To create “siteStatus” variableAccess “mvar”_list”, showing icmpLoss for site
Examine variables for routers to see if all are down. Repeat for switches
Compute new variable. In this example, if all routers and/or switches are down, variable=100
Export new variable
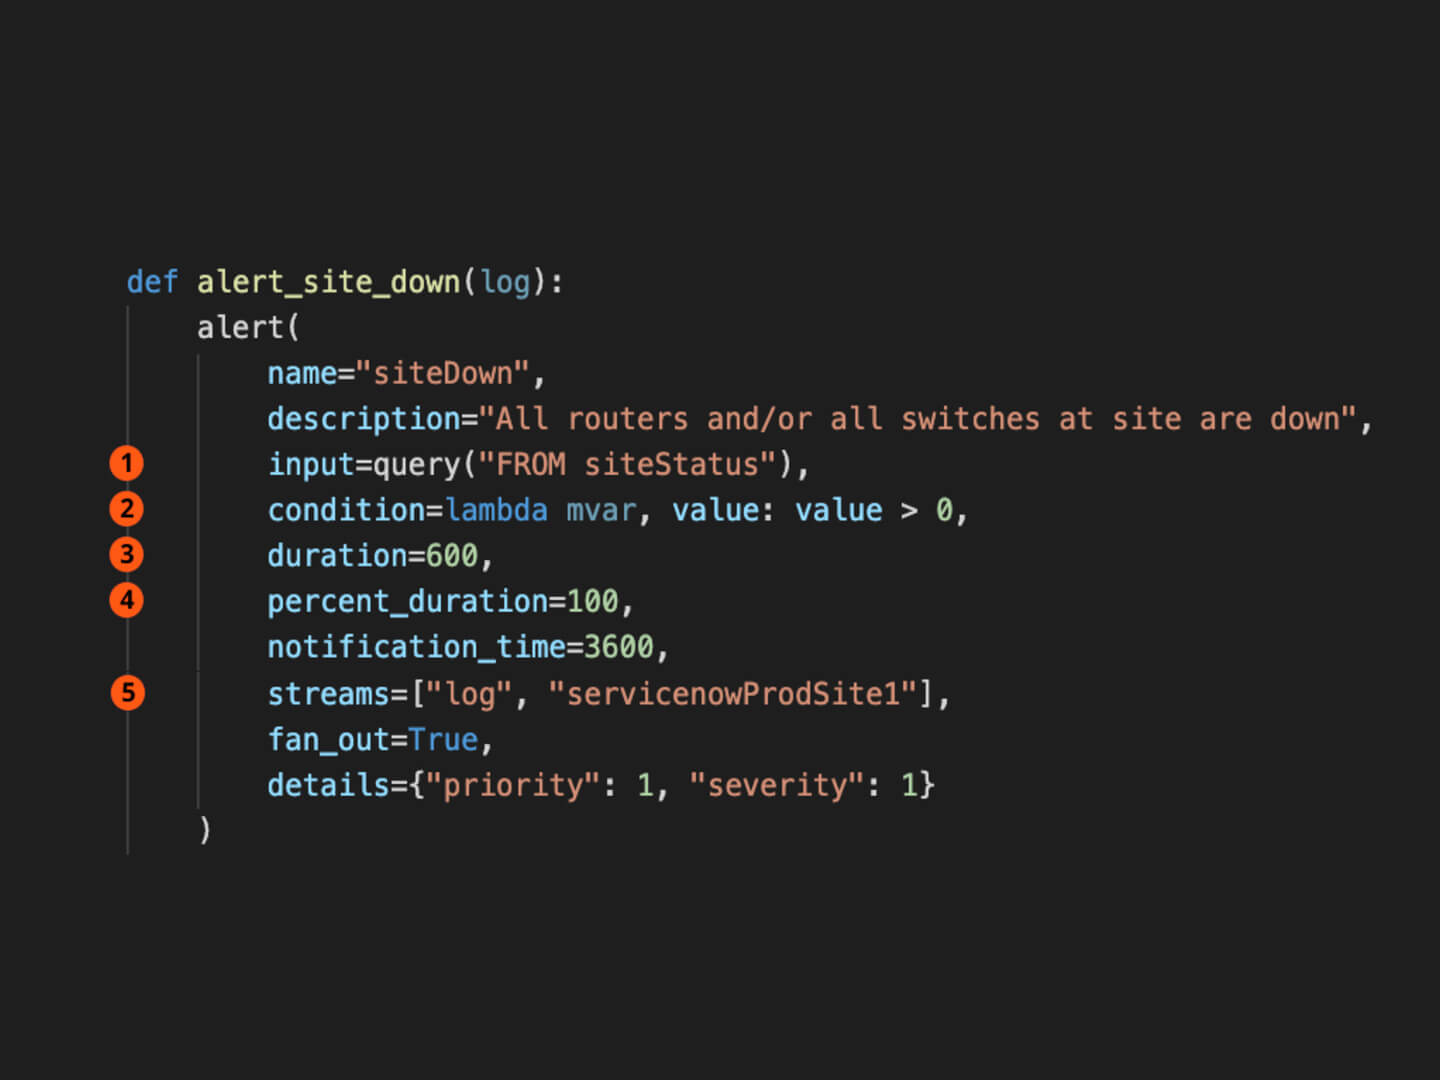
To create customer “siteDown” alertImport variable using NsgQL
When siteStatus > 0…
…within 10 minute window…
… for 100% of that time
Alert becomes active and notifies selected streams
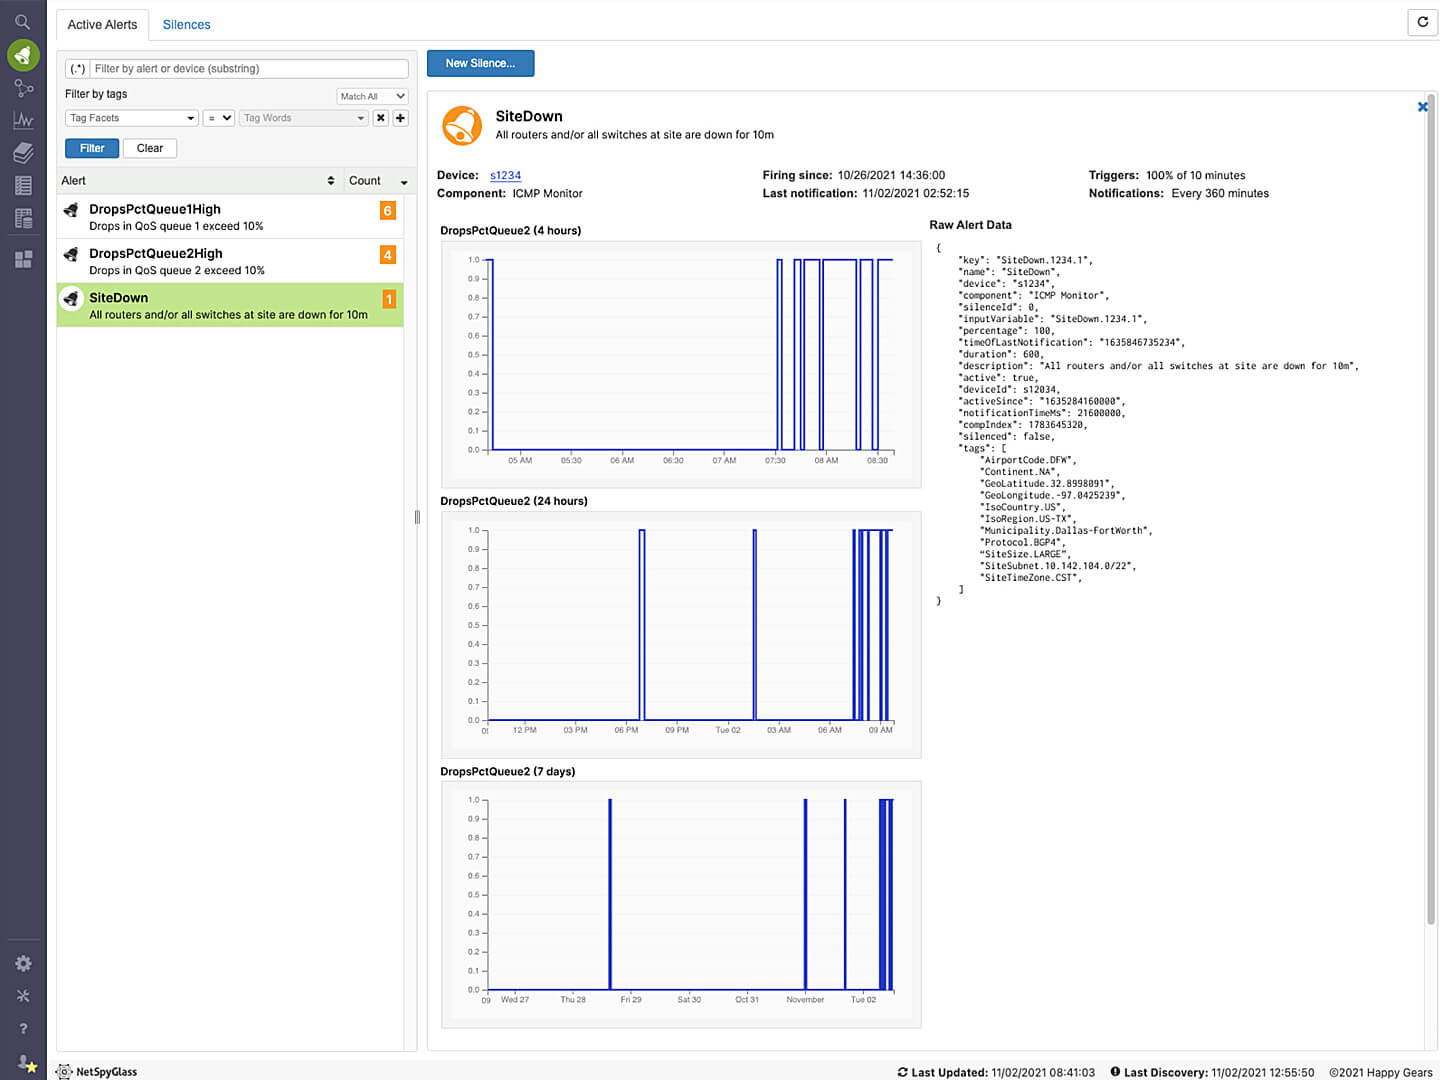
When triggered, the SiteDown alert includes information about the alert, as well as graphs of the status over 4 hours, 1 day, and 1 week.
Architecture
Explore the graphic to learn more about NSG’s cloud-based architecture then call us for a free demo.
Please view the tour on a desktop or laptop computer.
Copyright © 2025. All right reserved.
